RAREFIED FLOW · SCIENTIFIC COMPUTING

Einar Nævdal

Aerothermodynamics Engineer

Explore the work
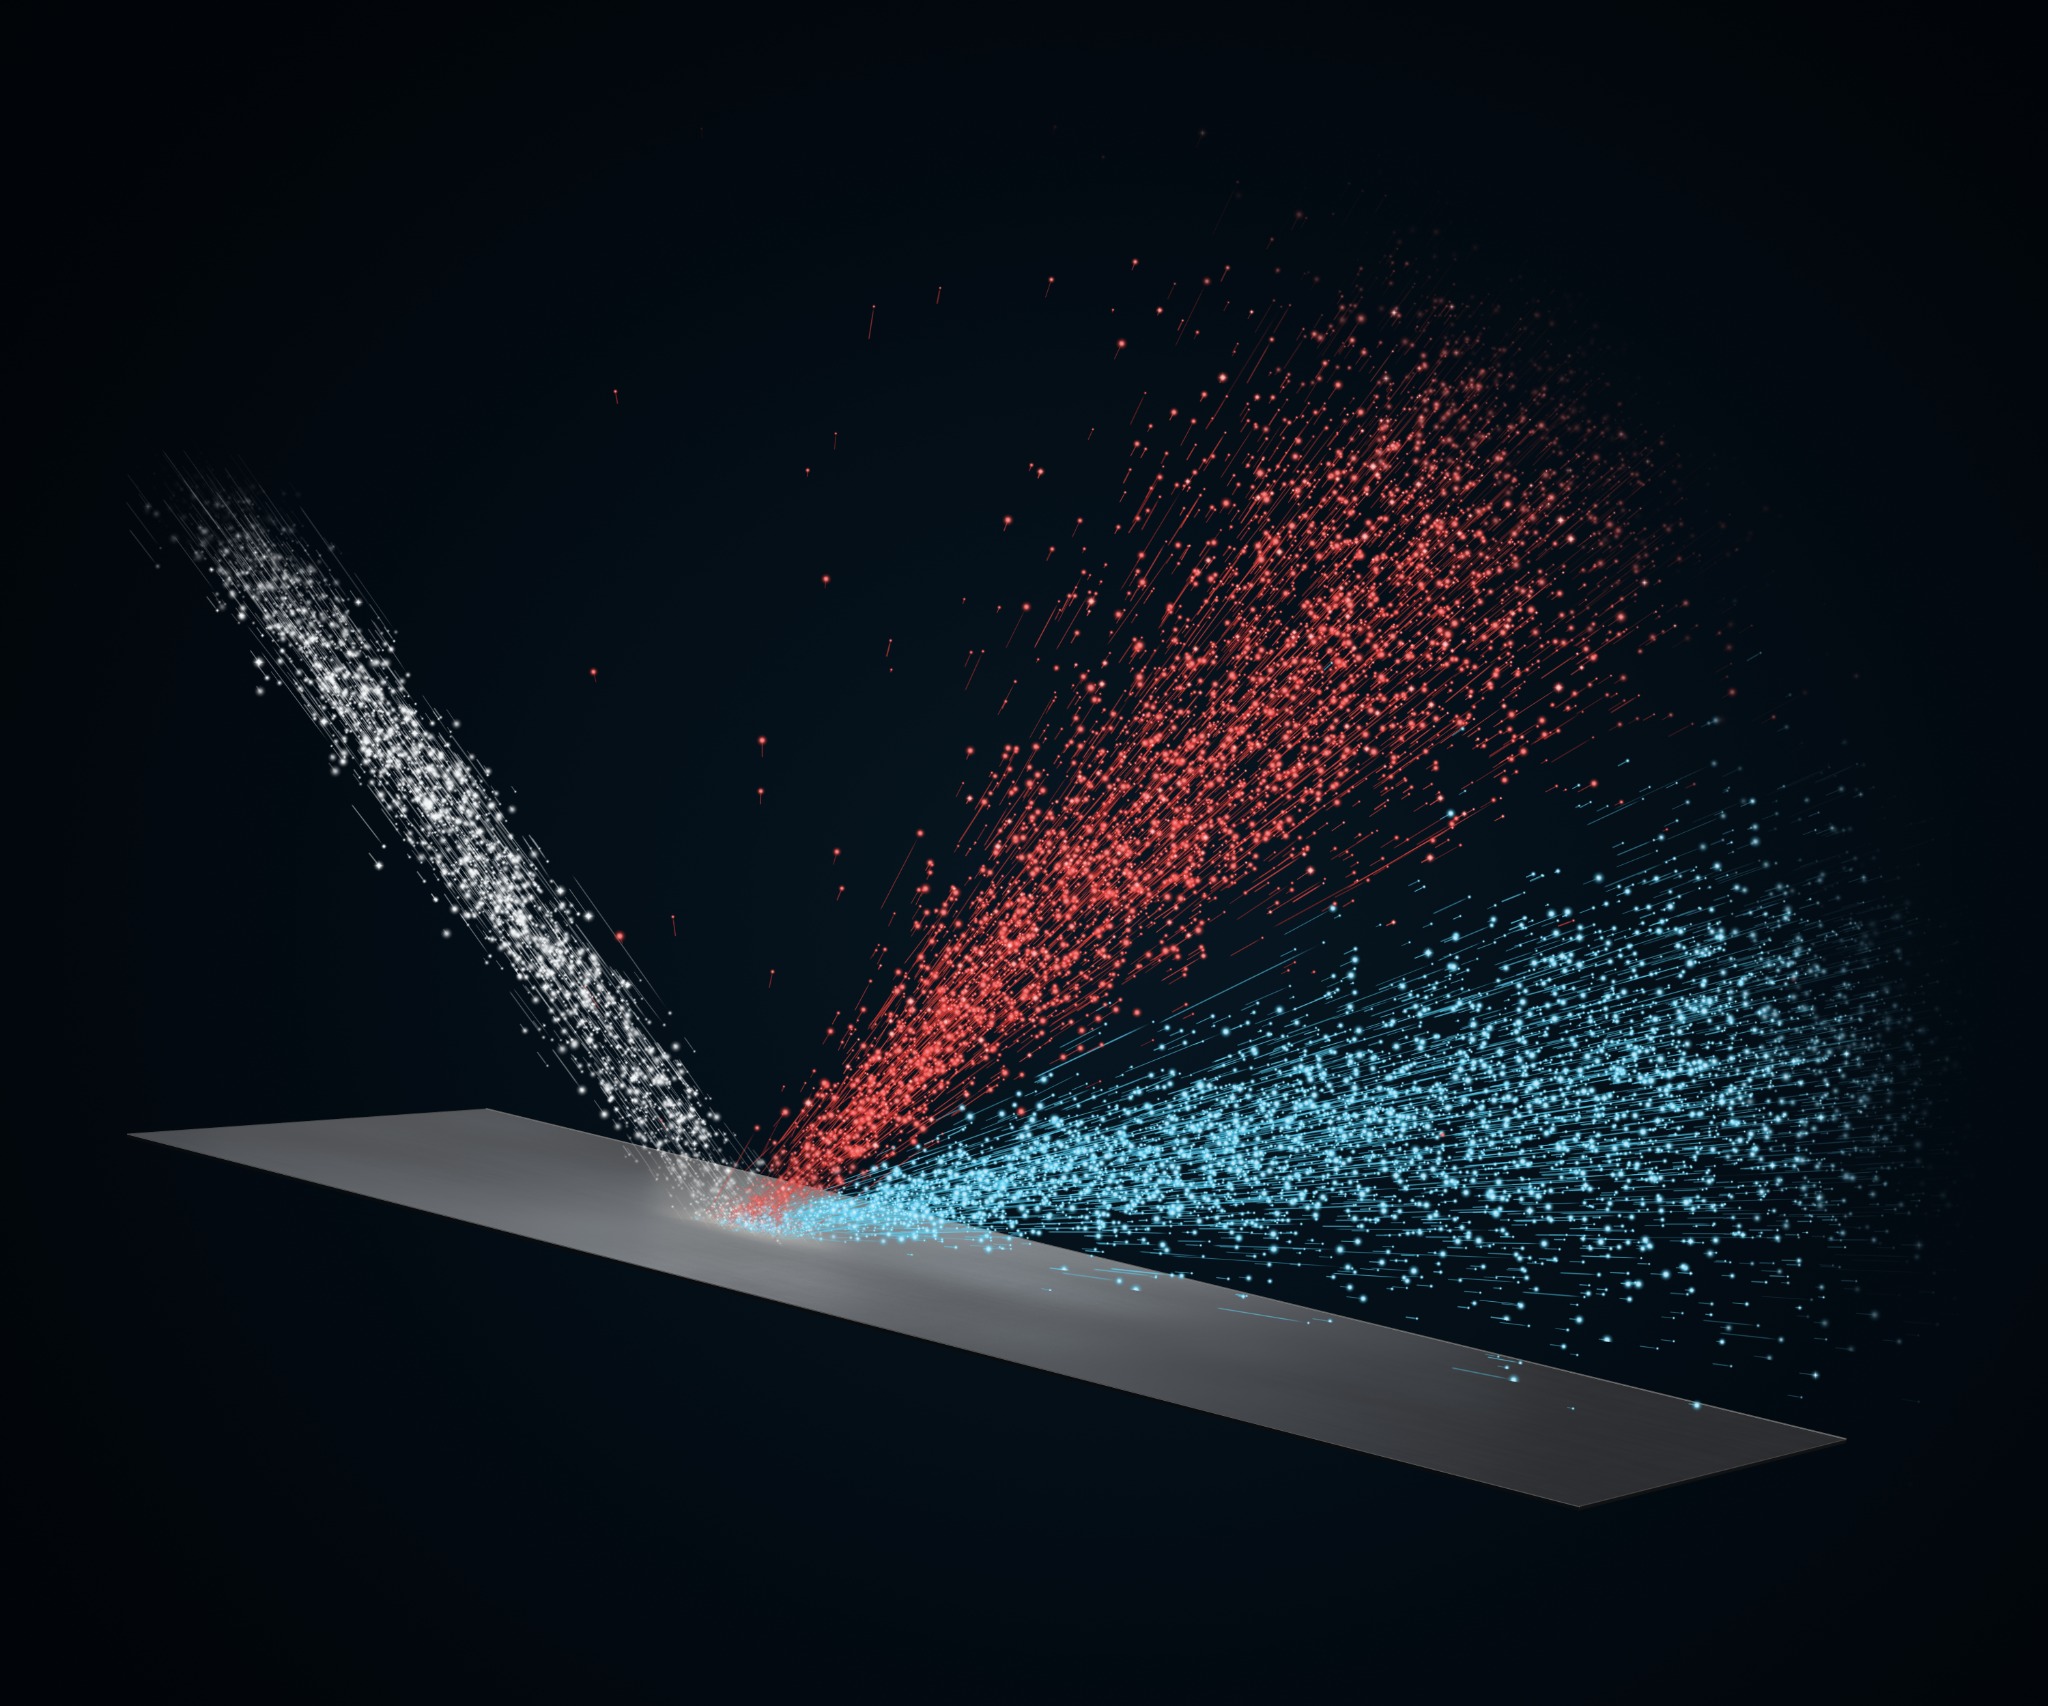
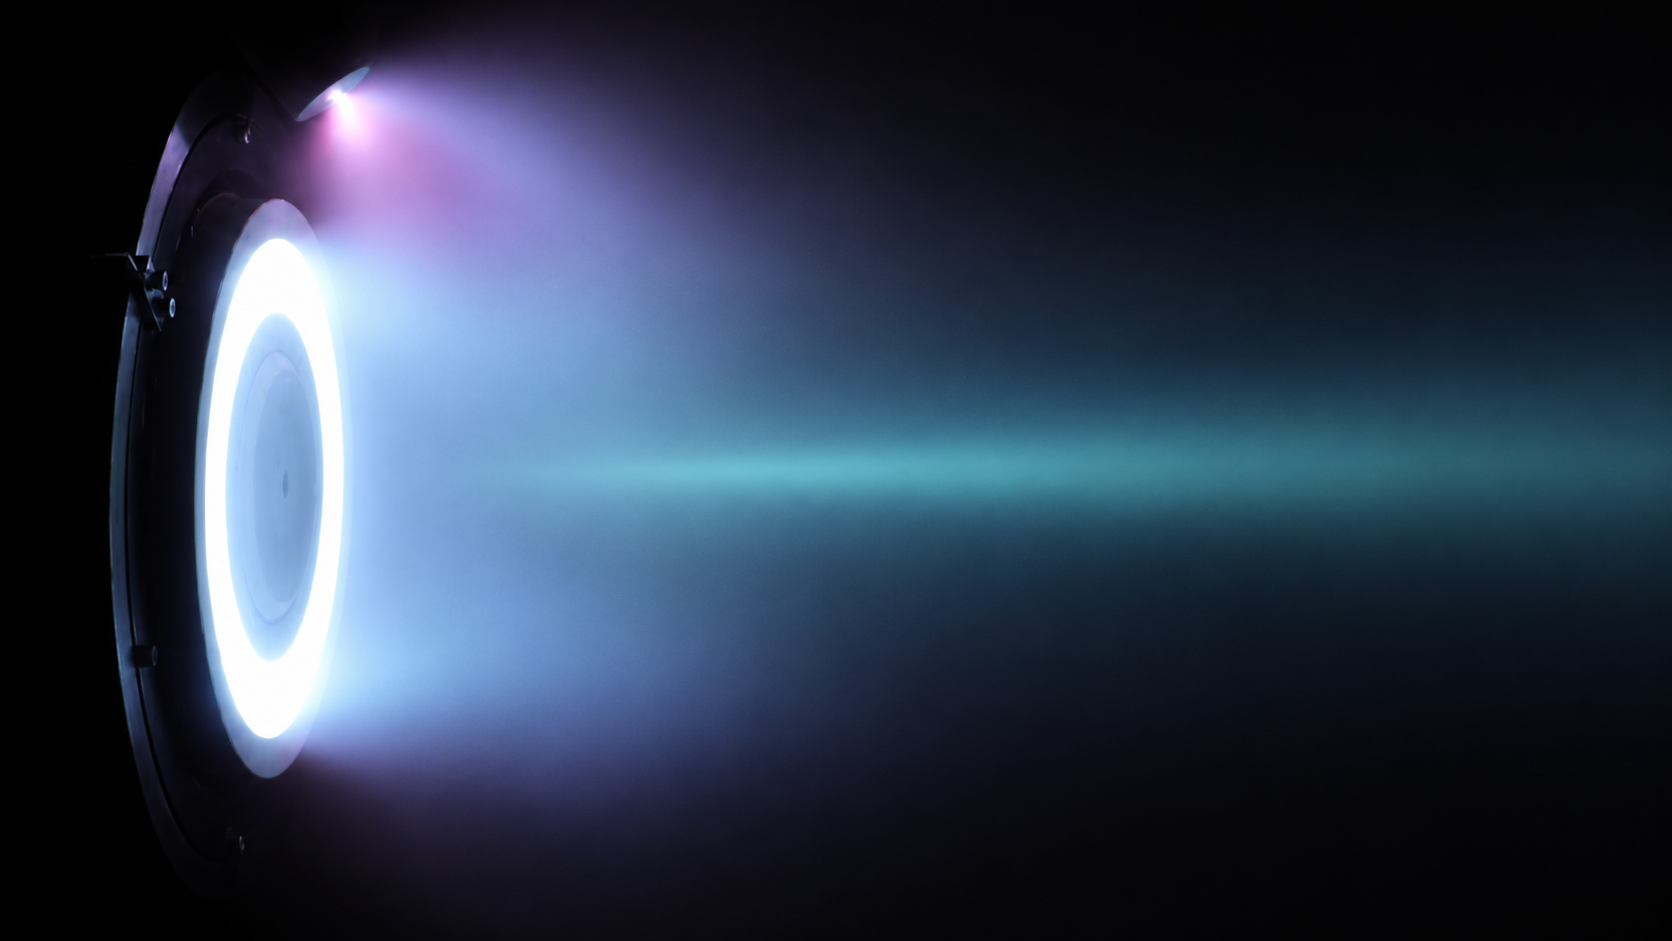
Illustrative visual · not simulation data

Physics, computation
and practical engineering.

I’m an aerothermodynamics engineer at the European Space Agency, working on rarefied-gas dynamics and the scientific software used to study it.

My work connects molecular-scale modelling with the questions it can answer about flow, forces and heating. Alongside DSMC research, my engineering background spans three-dimensional flow and heat transfer, electromagnetic simulation, and instrumented hardware.

CURRENT
European Space Agency · ESTEC
FOCUS
Rarefied flow & gas–surface interaction
APPROACH
Model · simulate · build · test

Gas–surface interaction.

From scattering laws to aerodynamic response.

arXiv Link forthcoming

Gas–surface scattering and collisional feedback in rarefied hypersonic flow past an inclined flat plate

Einar Nævdal & Sebastian A. Altmeyer · 2026

Changing how molecules leave a surface can also change how they reach it.

Using direct simulation Monte Carlo (DSMC) in SPARTA, I compared seven Maxwell and Cercignani–Lampis–Lord (CLL) scattering configurations at four prescribed rarefaction conditions. The 28-case study resolves pressure, shear, heating and compression-side aerodynamic loads for a 1 m plate at 40° incidence in a 7.5 km/s flow.

The central question is whether a load change comes from the scattering law itself or from the incident gas that the law helps create. I combined fixed-incidence references, cross-kernel evaluation of recorded non-reactive impacts, and correlation-aware uncertainty analysis to separate those contributions.

Conceptual illustration of an incident molecular stream and two reflected populations above a flat plate.
Conceptual graphical abstract · not a particle trajectory plot
METHOD
DSMC · SPARTA
RAREFACTION
Kn∞ = 0.023–8.439
STUDY
4 regimes · 7 scattering configurations

Beyond endpoint interpolation.

At Kn∞ = 0.023, Maxwell shear and heat-transfer responses depart from diffuse–specular endpoint interpolation by up to 40% of their diffuse-reference values.

Feedback can reverse a local response.

At Kn∞ = 0.023, the population change induced by reduced tangential CLL accommodation overturns the fixed-incidence reductions in trailing-patch shear and translational heat transfer.

Nearly equal lift. Different drag.

At Kn∞ = 8.439, exchanging the normal and tangential CLL accommodation coefficients produces nearly equal lift, while one case generates 66% more drag.

These are controlled model comparisons, not material-specific performance claims. The CLL coefficients are sensitivity probes; the reported aerodynamic loads refer to the compression side of the plate.

Methods, interpretation & scope

The scattering law was varied while the remaining physical and numerical settings were held fixed within each prescribed Knudsen-number condition. Recorded non-reactive incident populations were evaluated under alternative CLL kernels, distinguishing the conditional wall response from the change in the population arriving at the surface.

Production estimates use retained sampling windows and covariance estimates that account for temporal correlation. Benchmark comparisons, local event diagnostics and integrated surface quantities remain distinct; the local sign reversals above do not imply an increase in full-side shear or total production heating.

At the highest prescribed Knudsen number, a total-energy constraint required by common incidence across wall laws retains a defect of 3.1% of the diffuse heat-transfer coefficient. Recovery of selected scattering-response relations therefore does not establish identical incident populations or a fully free-molecular flow.

The simulations, in motion.

Supplementary research films
FILM 01

Particle motion across four rarefaction regimes.

Open film (opens in a new tab)

Early flow development in four diffuse-Maxwell DSMC visualisation runs at Kn∞ = 0.023, 0.137, 3.146 and 8.439. The points are weighted simulator particles, not physical molecules; their apparent concentration is not a direct measure of gas density.

How to read this film

Each visualisation run began with an empty domain. The displayed sequence starts after particle injection has commenced and ends before the retained production sampling interval. These separate runs contribute neither the reported production means nor their uncertainty estimates.

Particle weights vary with the case and local cell area. Apparent changes in occupancy at mesh-refinement interfaces need not represent physical density discontinuities. Quantitative density comparisons use weighted grid tallies instead.

FILM 02

A change at the wall. A response in the flow.

Open film (opens in a new tab)

Normalised number-density fields at Kn∞ = 0.023 and 8.439 show the response to successive changes in CLL accommodation. Each panel is an ensemble mean of 32 independently seeded simulations (M = 32), with every realisation advanced continuously through the same five wall states.

CLL sequence · (αn, αt)

(0.8, 0.8) then (0.8, 0.2) then (0.8, 0.8) then (0.2, 0.8) then (0.8, 0.8)

How to read this film

M = 32 is the ensemble size, not the Mach number. The displayed quantity is n* = n/n∞: total-mixture number density normalised by the corresponding freestream value. The colour limits remain fixed throughout the movie.

Only the active plate-collision assignment changes at each switch. Particles, mesh, inflow, gas collisions, chemistry and random-number state remain continuous; no restart is read. The initial state includes empty-domain filling. Later baseline states are returns within each trajectory, not independent replicate blocks.

The panels share wall state and playback progress, not dimensional physical time. Each wall state spans 10.032 ms at Kn∞ = 0.023 and 78.432 ms at Kn∞ = 8.439; these are prescribed observation horizons, not measured relaxation times.

Each displayed frame averages four non-overlapping source bins. Spatial filtering is for display only; no temporal interpolation, duplicated frames, cumulative averaging or optical-flow reconstruction is used. This auxiliary density campaign is separate from the production statistics.

European
Space Agency.

Graduate Trainee · Aerothermodynamics

ESTEC · Noordwijk

Modernising the tools
behind rarefied-flow simulation.

My work at ESA focuses on DSMC code modernisation for spacecraft aerothermodynamics: connecting numerical methods, scientific software and the analysis of rarefied flows.

01

Rarefied-gas methods

Particle-based modelling for spacecraft aerothermodynamics.

02

Scientific software

DSMC code modernisation and practical computational workflows.

03

Verification & analysis

Numerical checks, benchmark comparisons and interpretable results.

Public project notes will be added as work becomes available for release.

3D aerothermal modelling.

Conjugate heat transfer in a heated wing.

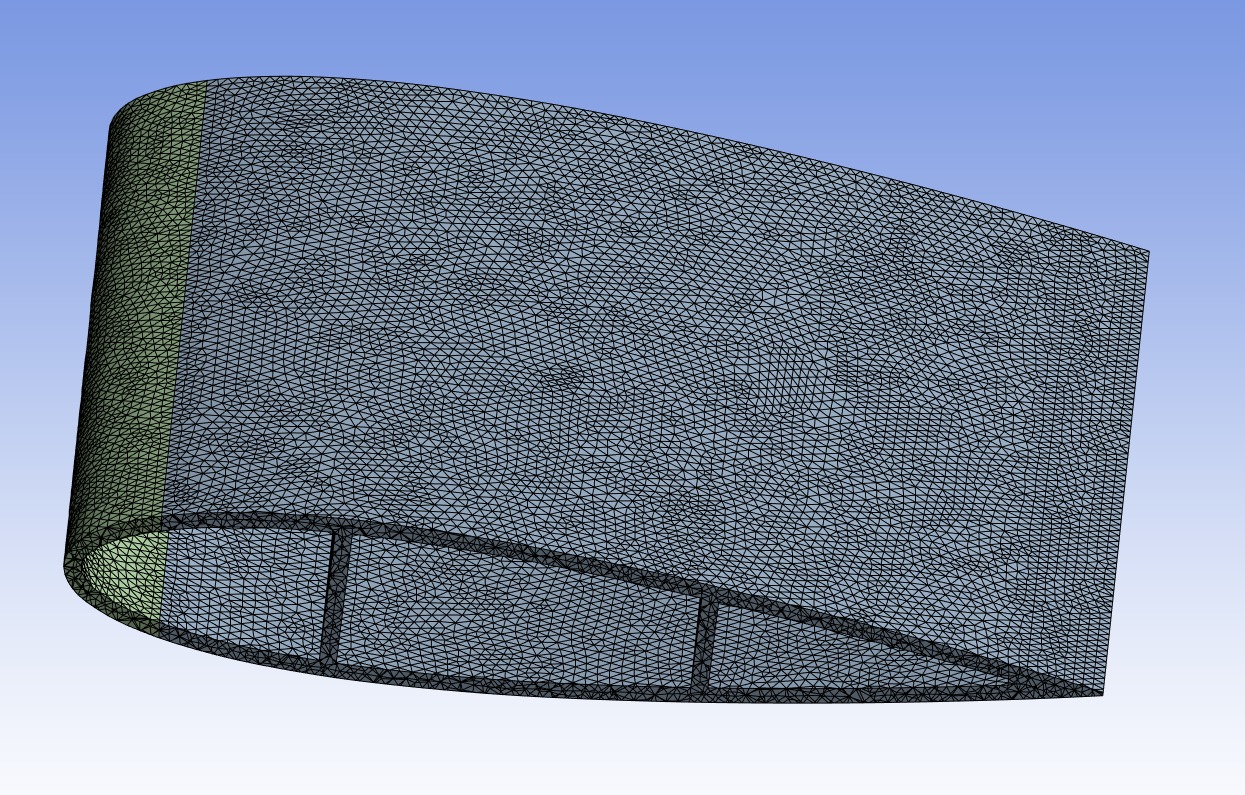
A three-dimensional, steady-state ANSYS Fluent model coupling heat conduction in a wing with convective heat transfer in the surrounding flow. Mesh checks and flow-field analysis support comparison with analytical cylinder benchmarks and wind-tunnel measurements.

  • ANSYS Fluent
  • 3D CFD
  • Conjugate heat transfer
  • Experimental comparison
Three-dimensional wing mesh showing the surface discretisation and internal ribs.
The computational modelThree-dimensional mesh of the wing geometry.
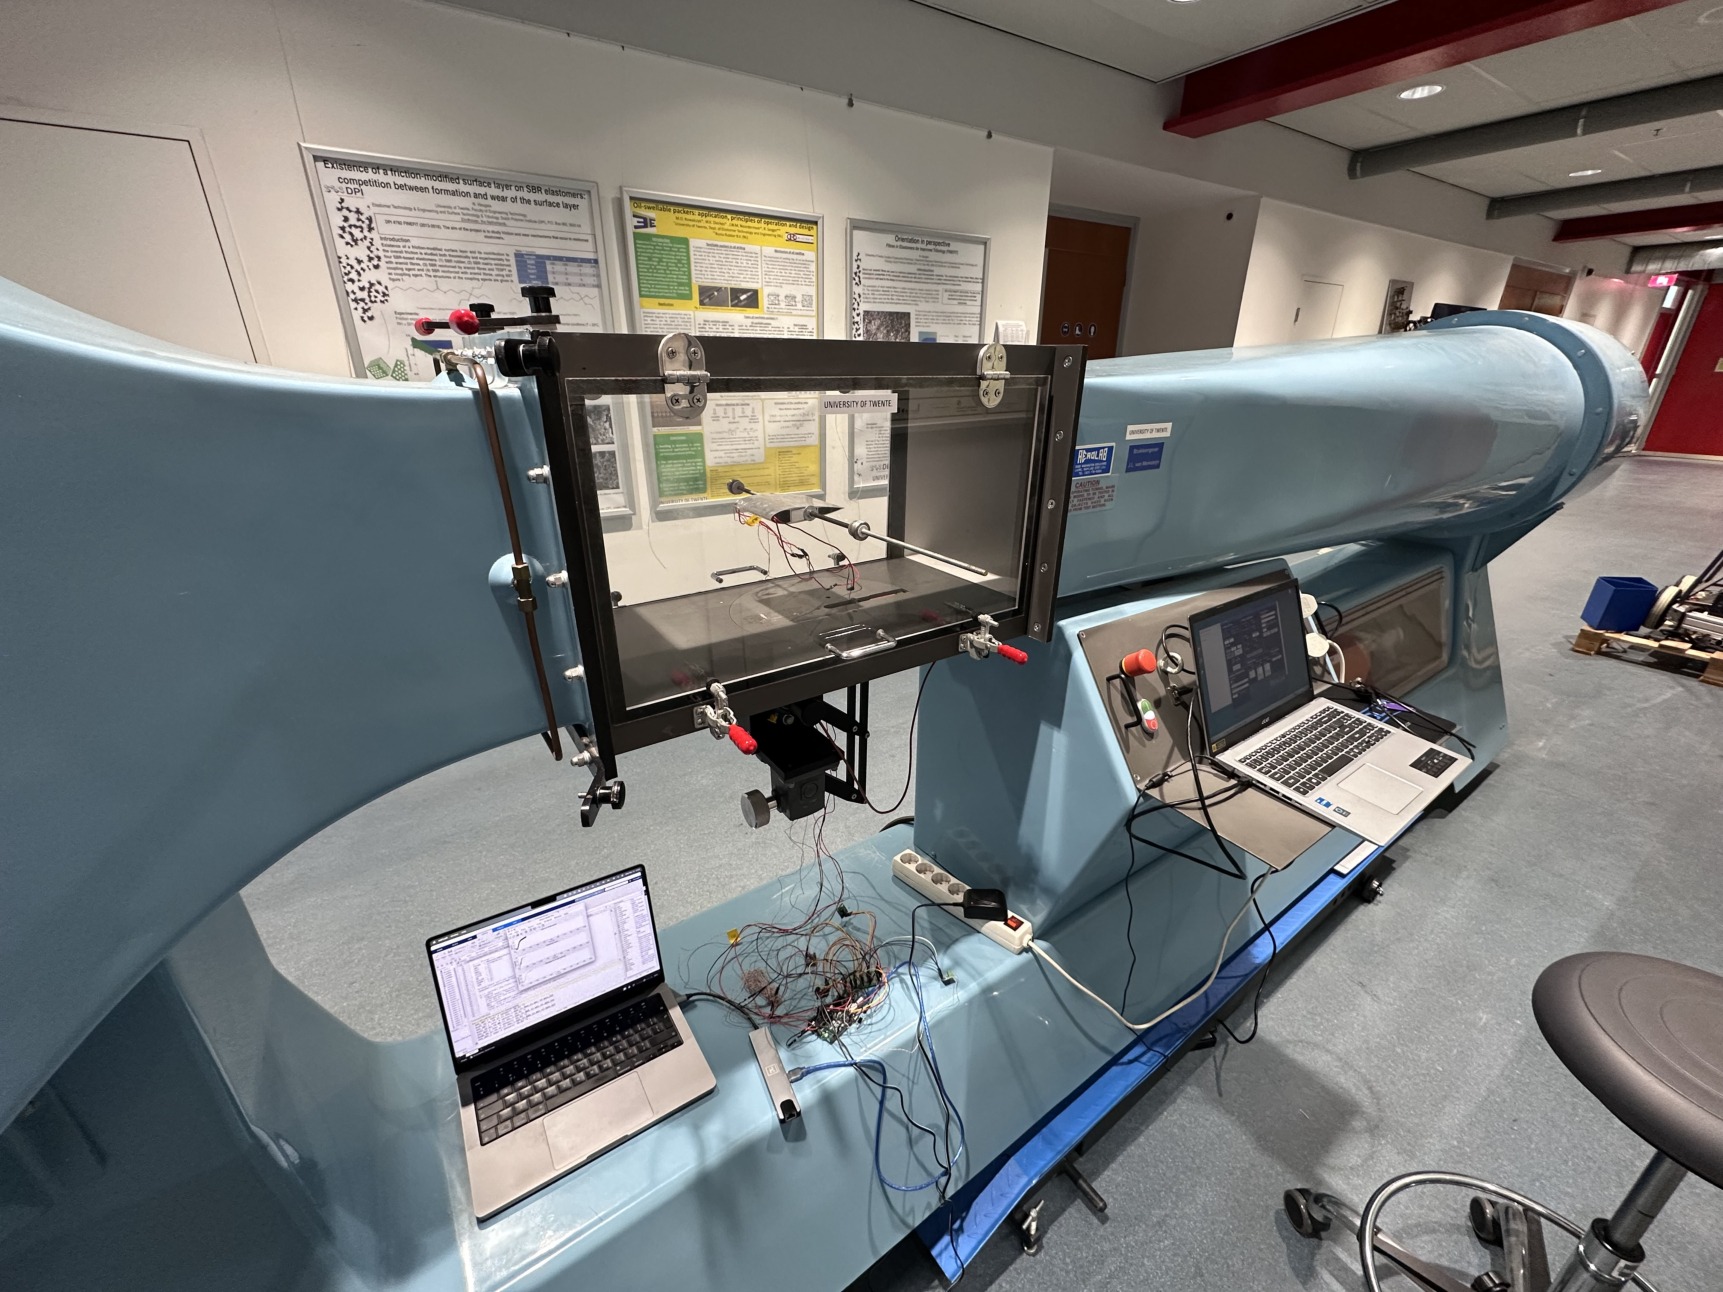
Wind tunnel with an instrumented test section, measurement wiring and laptops.
The experimental referenceWind-tunnel setup used for the validation measurements.
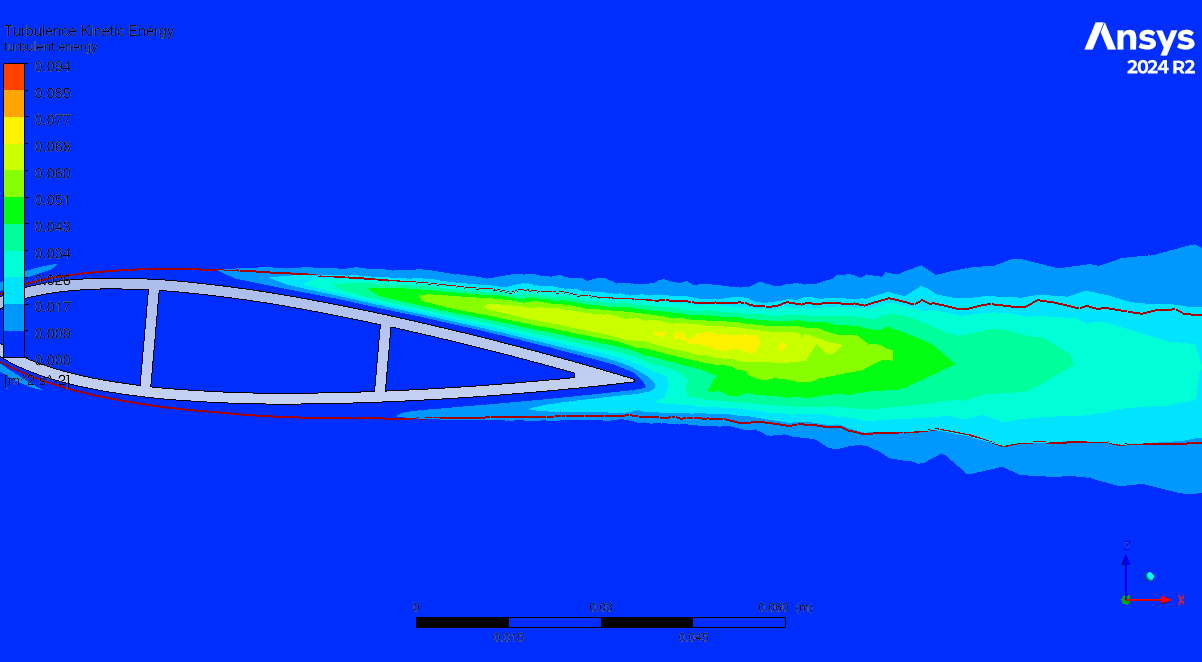
ANSYS contour plot of turbulent kinetic energy around a wing section and in its wake.
Boundary layer & wakeTurbulent kinetic energy with the boundary-layer outline at Re = 10⁴.
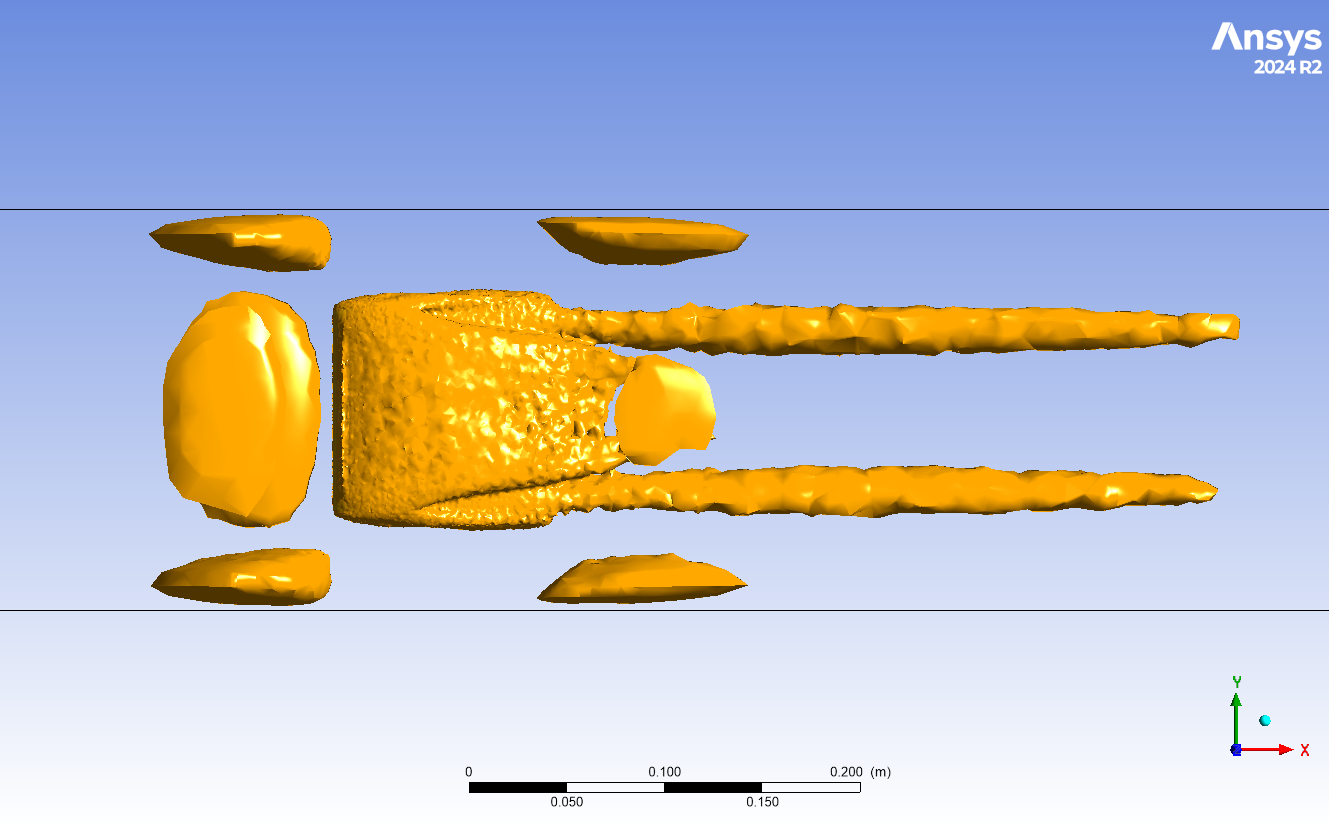
Gold-coloured Q-criterion isosurfaces showing elongated structures downstream of the wing.
Three-dimensional flow structureQ-criterion isosurface at Q₀ = 0.2 s⁻²: wingtip vortices and tunnel-wall footprints.
Temperature gradients through the wing

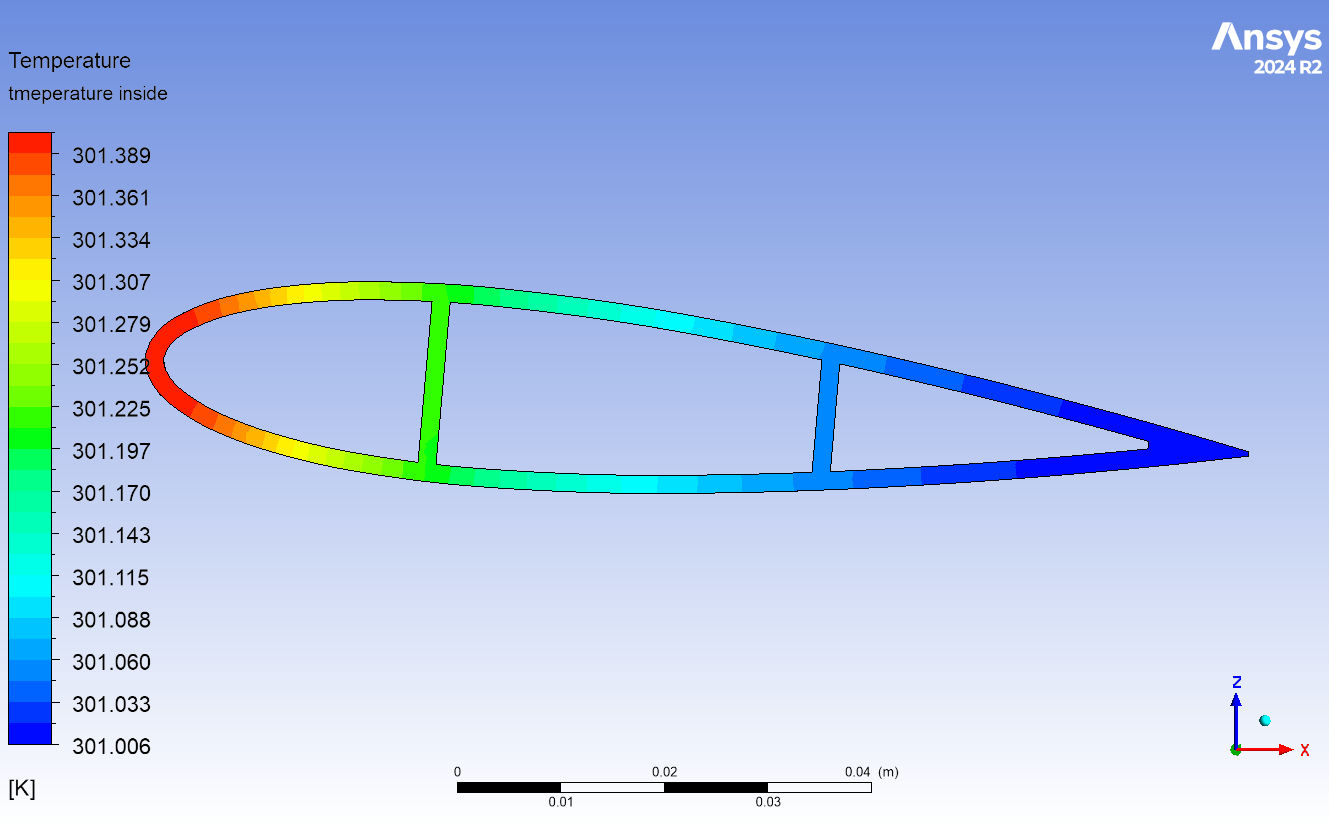
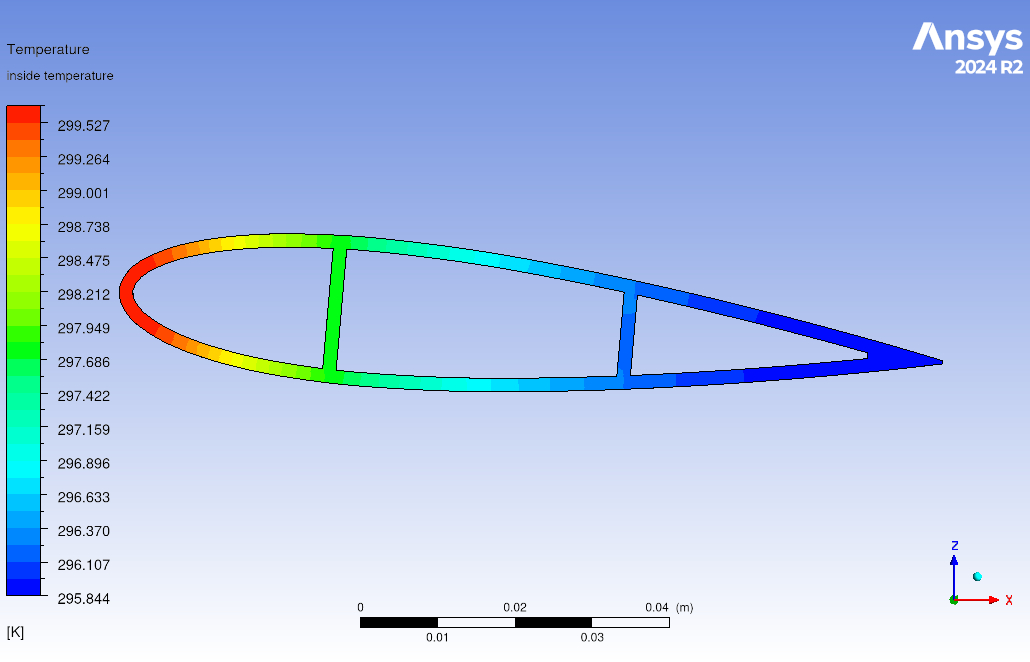
Two Biot-number cases illustrate the leading-to-trailing-edge temperature difference. Each contour retains its own original colour scale.

Wing-section temperature contour for Biot number 0.01, retaining the original temperature scale.
Bi = 0.01Leading-to-trailing-edge ΔT = 0.38 K.
Wing-section temperature contour for Biot number 0.12, retaining the original temperature scale.
Bi = 0.12Leading-to-trailing-edge ΔT = 3.68 K.

Beyond the simulation.

Fields, sensors and working hardware.

ELECTROMAGNETICS · RF HARDWARE

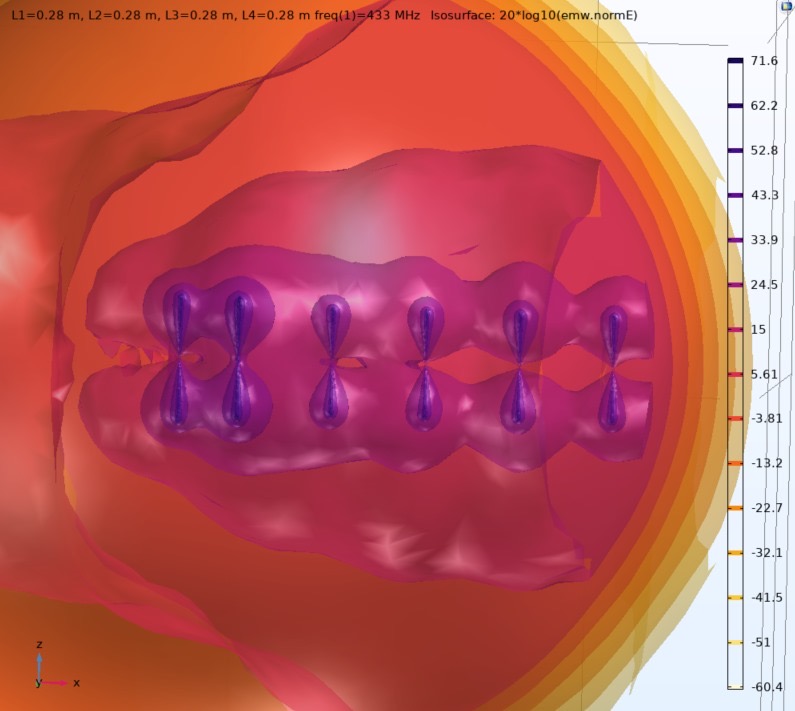
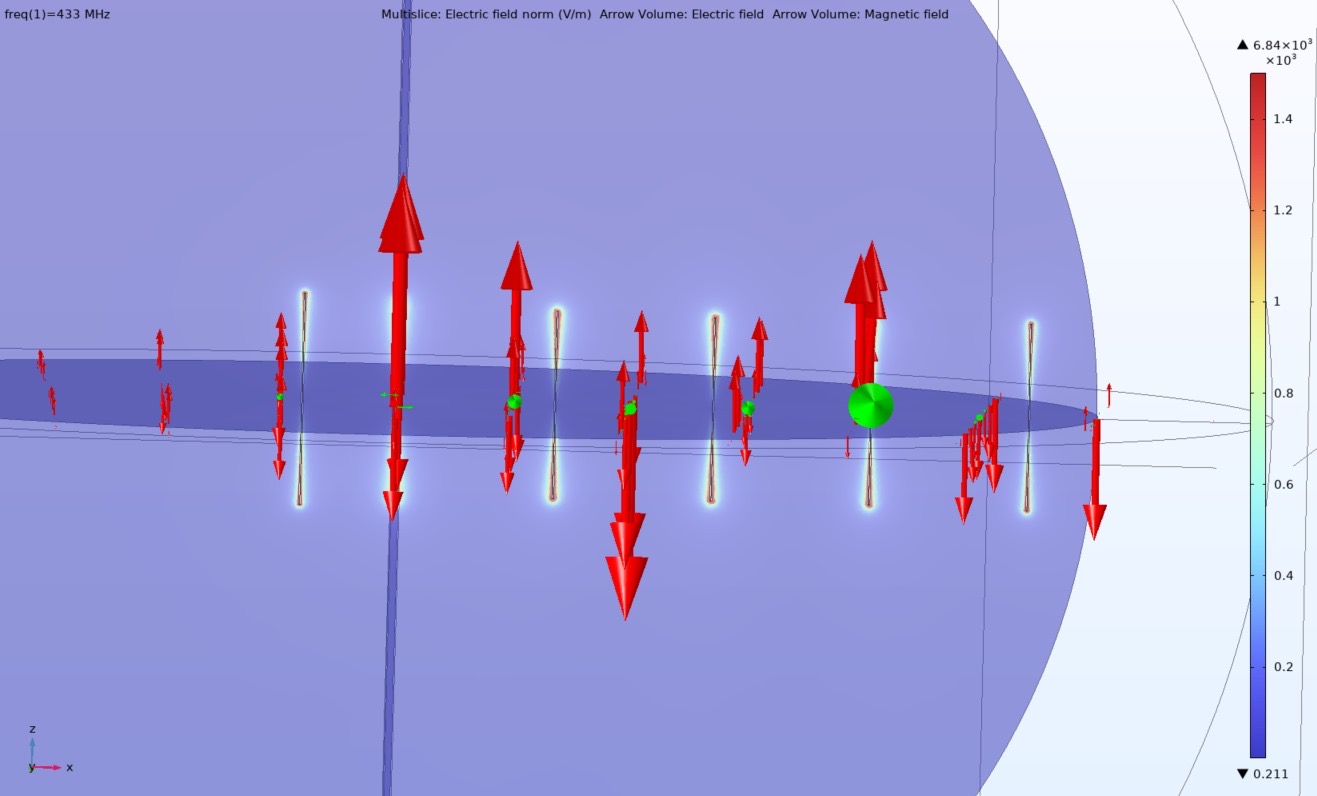
433 MHz Yagi–Uda antenna

Design, simulation and construction of a directional antenna, connecting electromagnetic theory with a physical build. COMSOL finite-element simulations informed the element geometry and field analysis, with a 50 Ω transmitter interface as a design requirement.

  • 433 MHz
  • COMSOL
  • Directivity
  • Impedance matching

SENSING · ELECTRONICS · MECHANICAL DESIGN

Three-axis strain-gauge accelerometer

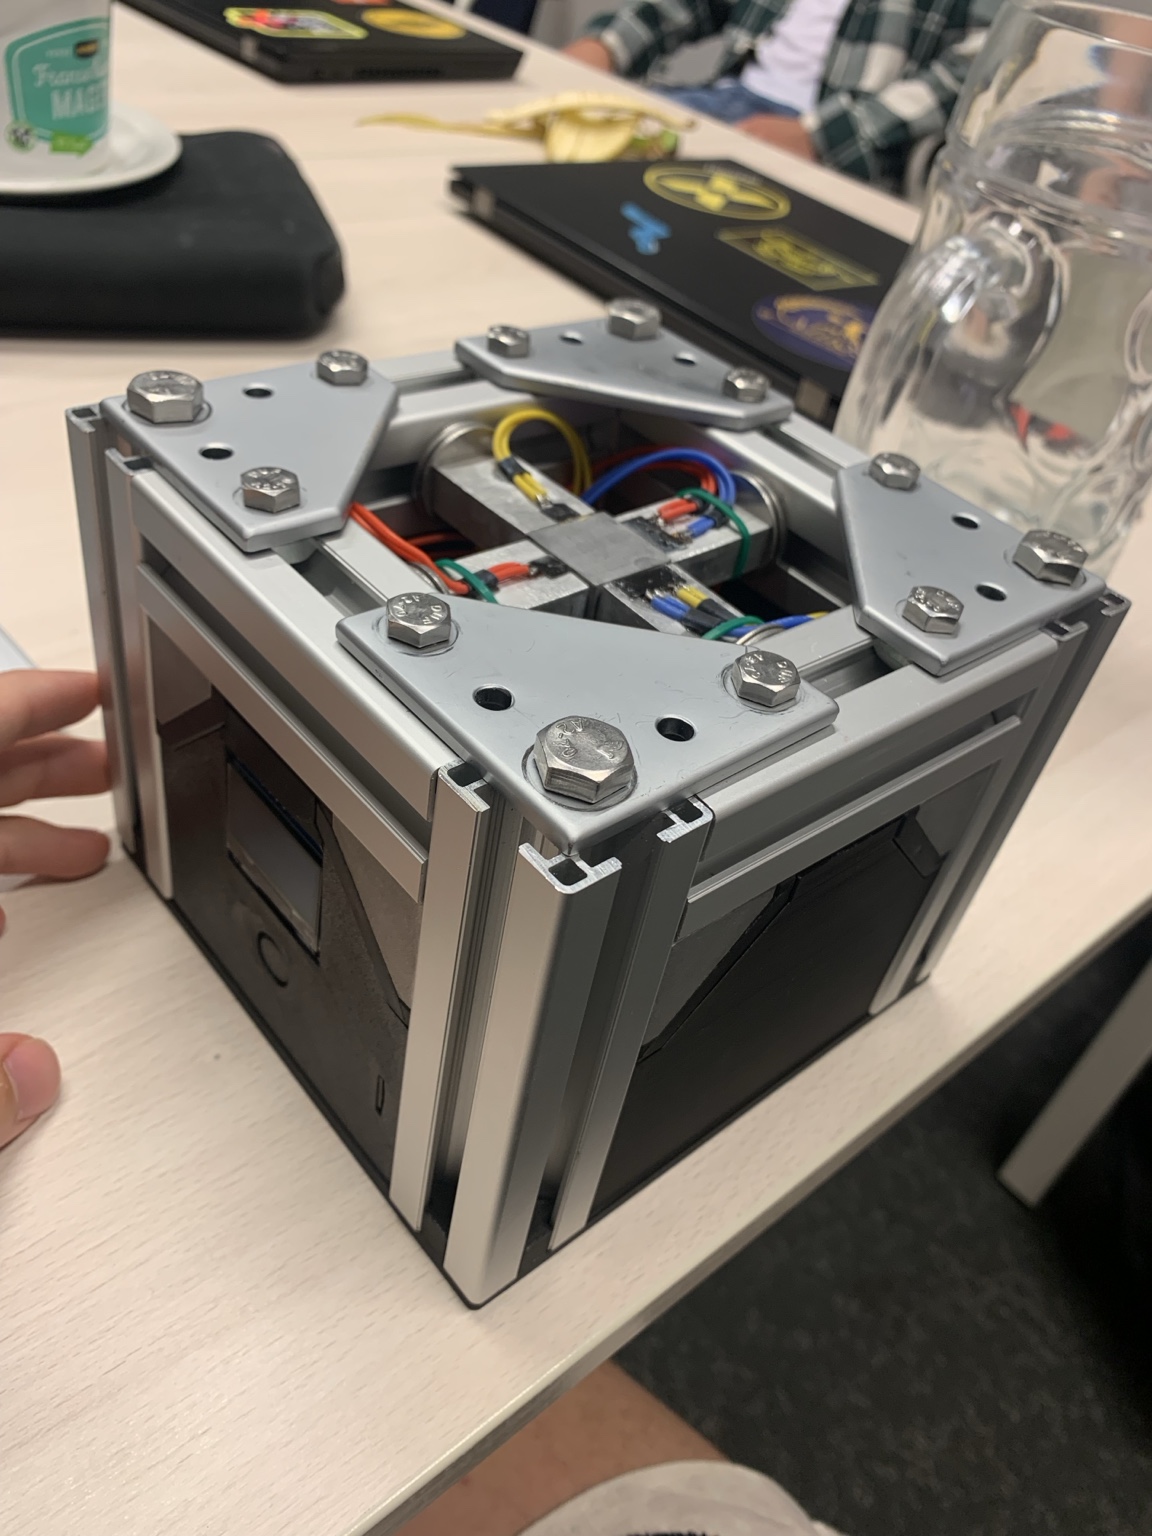
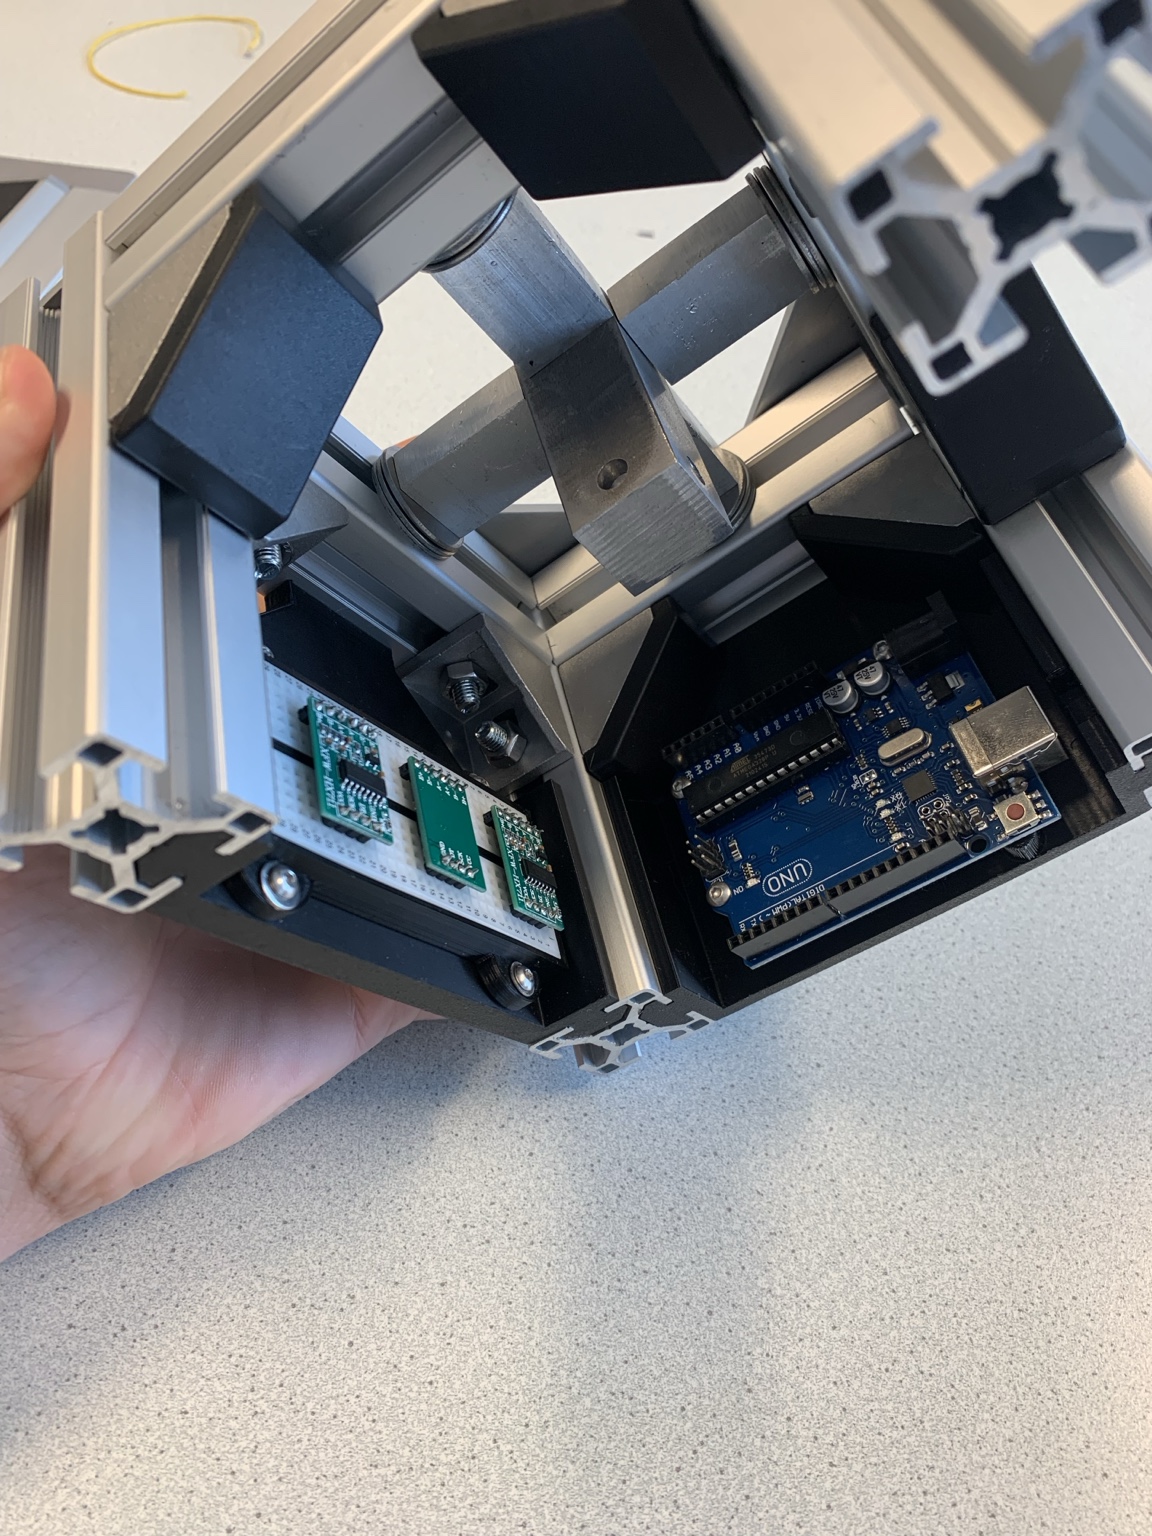
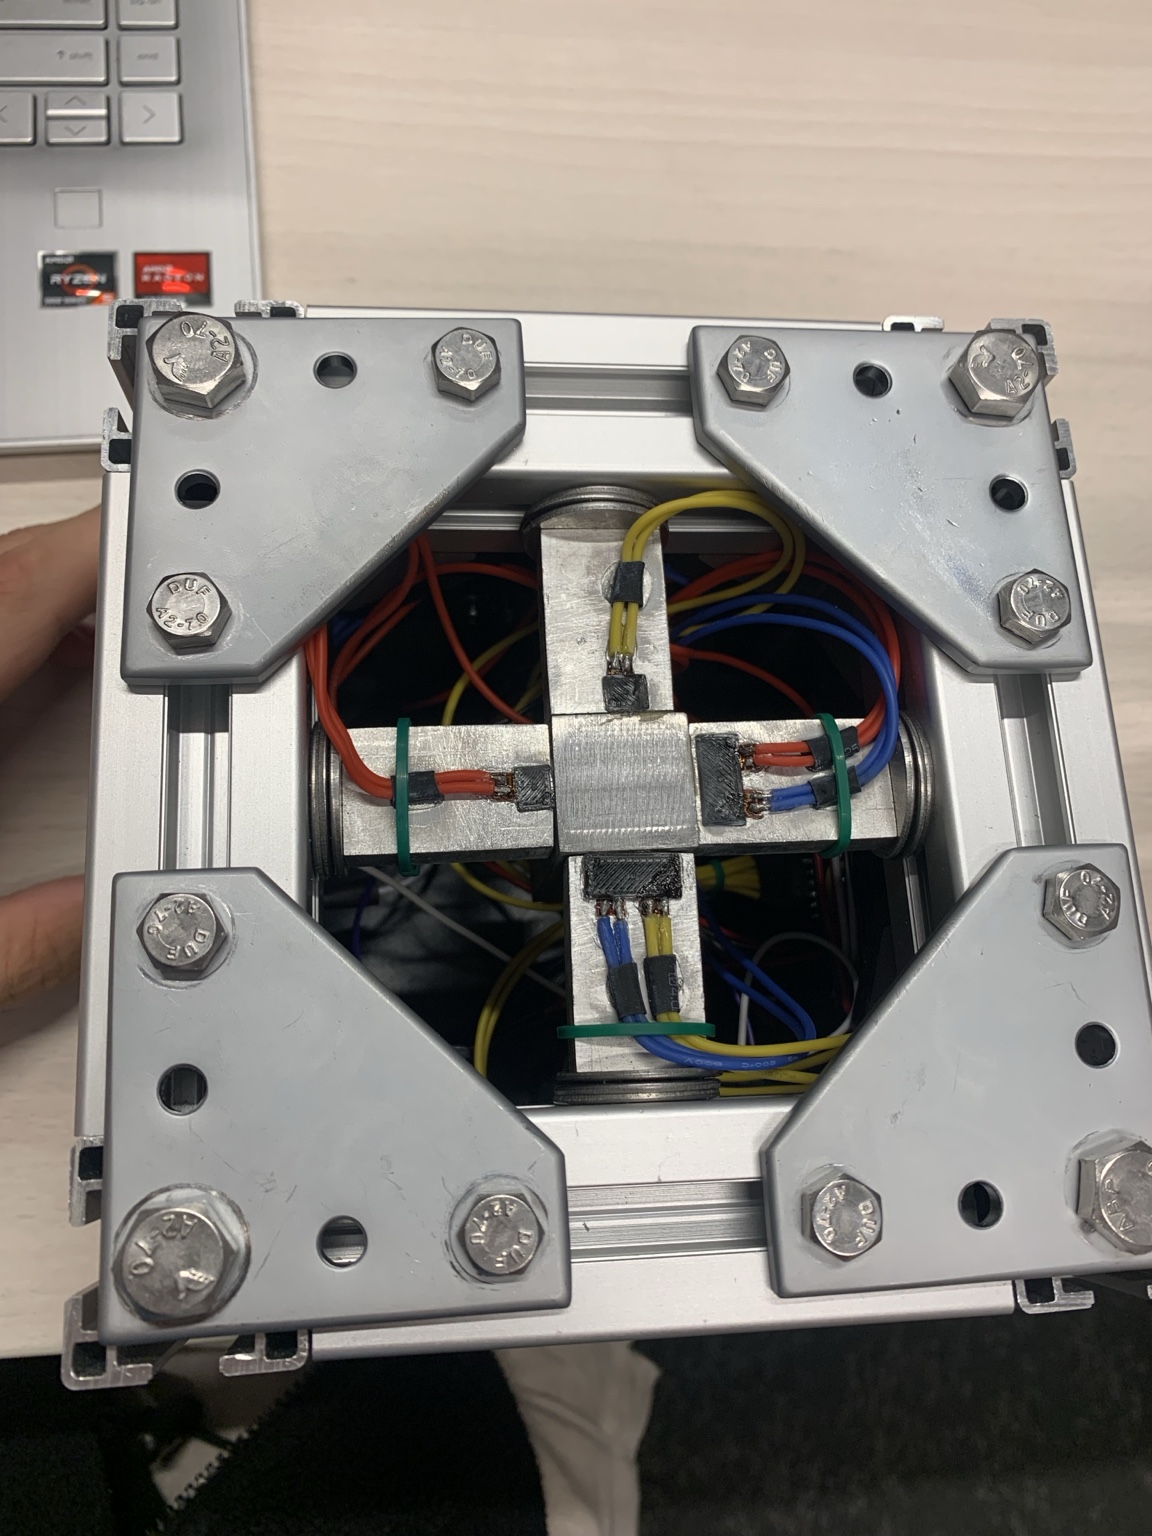
A compact instrument built around a central proof mass, four aluminium beams and twelve strain gauges. Three full Wheatstone bridges translate beam strain into voltage; HX711 conversion and an Arduino provide the three-axis readout.

Static-load and shock tests explored cross-axis response and the practical limits of the low-cost acquisition chain.

  • 3 axes
  • 12 strain gauges
  • Wheatstone bridges
  • Arduino
Assembled accelerometer in an aluminium extrusion enclosure on a work table.
Assembled prototypeMachined structure, aluminium extrusion frame and integrated electronics.
Interior of the accelerometer showing aluminium beams, a central steel mass, circuit boards and an Arduino UNO.
Inside the instrumentProof-mass suspension and the embedded acquisition electronics.
Top view of the accelerometer showing four aluminium beams and coloured strain-gauge wiring.
The sensing structureFour supporting beams, strain-gauge wiring and the central proof mass.
Design targets & prototype testing

The design targeted 20–150 g and a natural frequency around 7 kHz. These are design targets, not a validated operating envelope. The proof-of-concept used an HX711 acquisition chain with a maximum sample rate of 80 Hz. Testing exposed cross-axis sensitivity and mechanical fragility above approximately 30 g; a measured frequency response was not obtained.

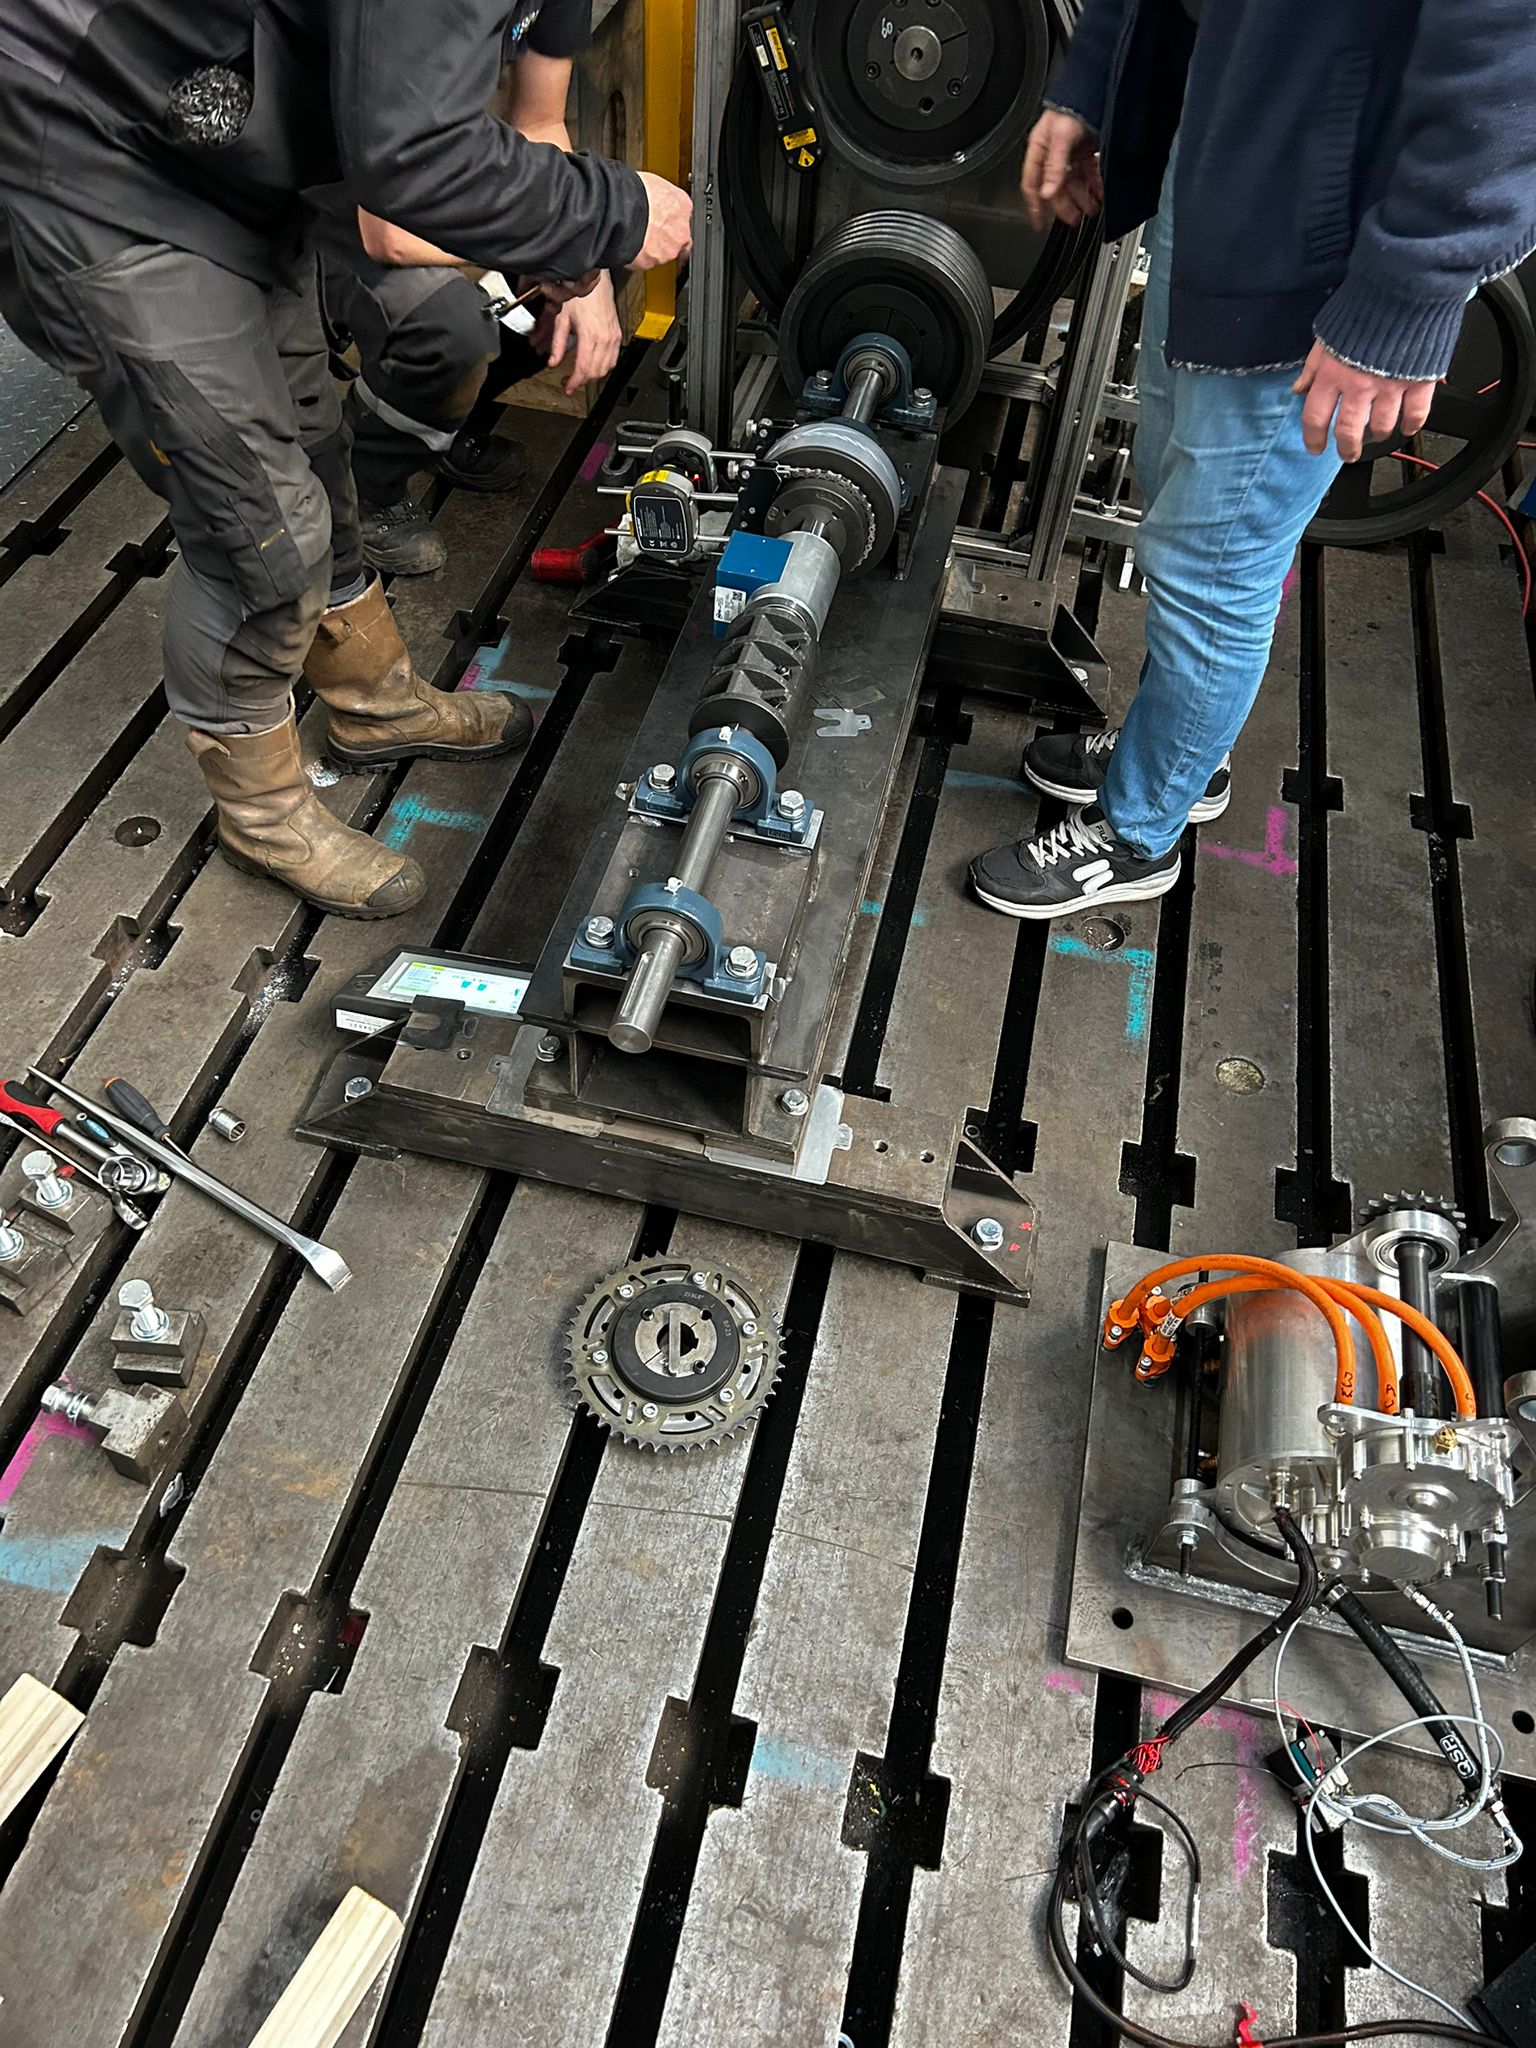
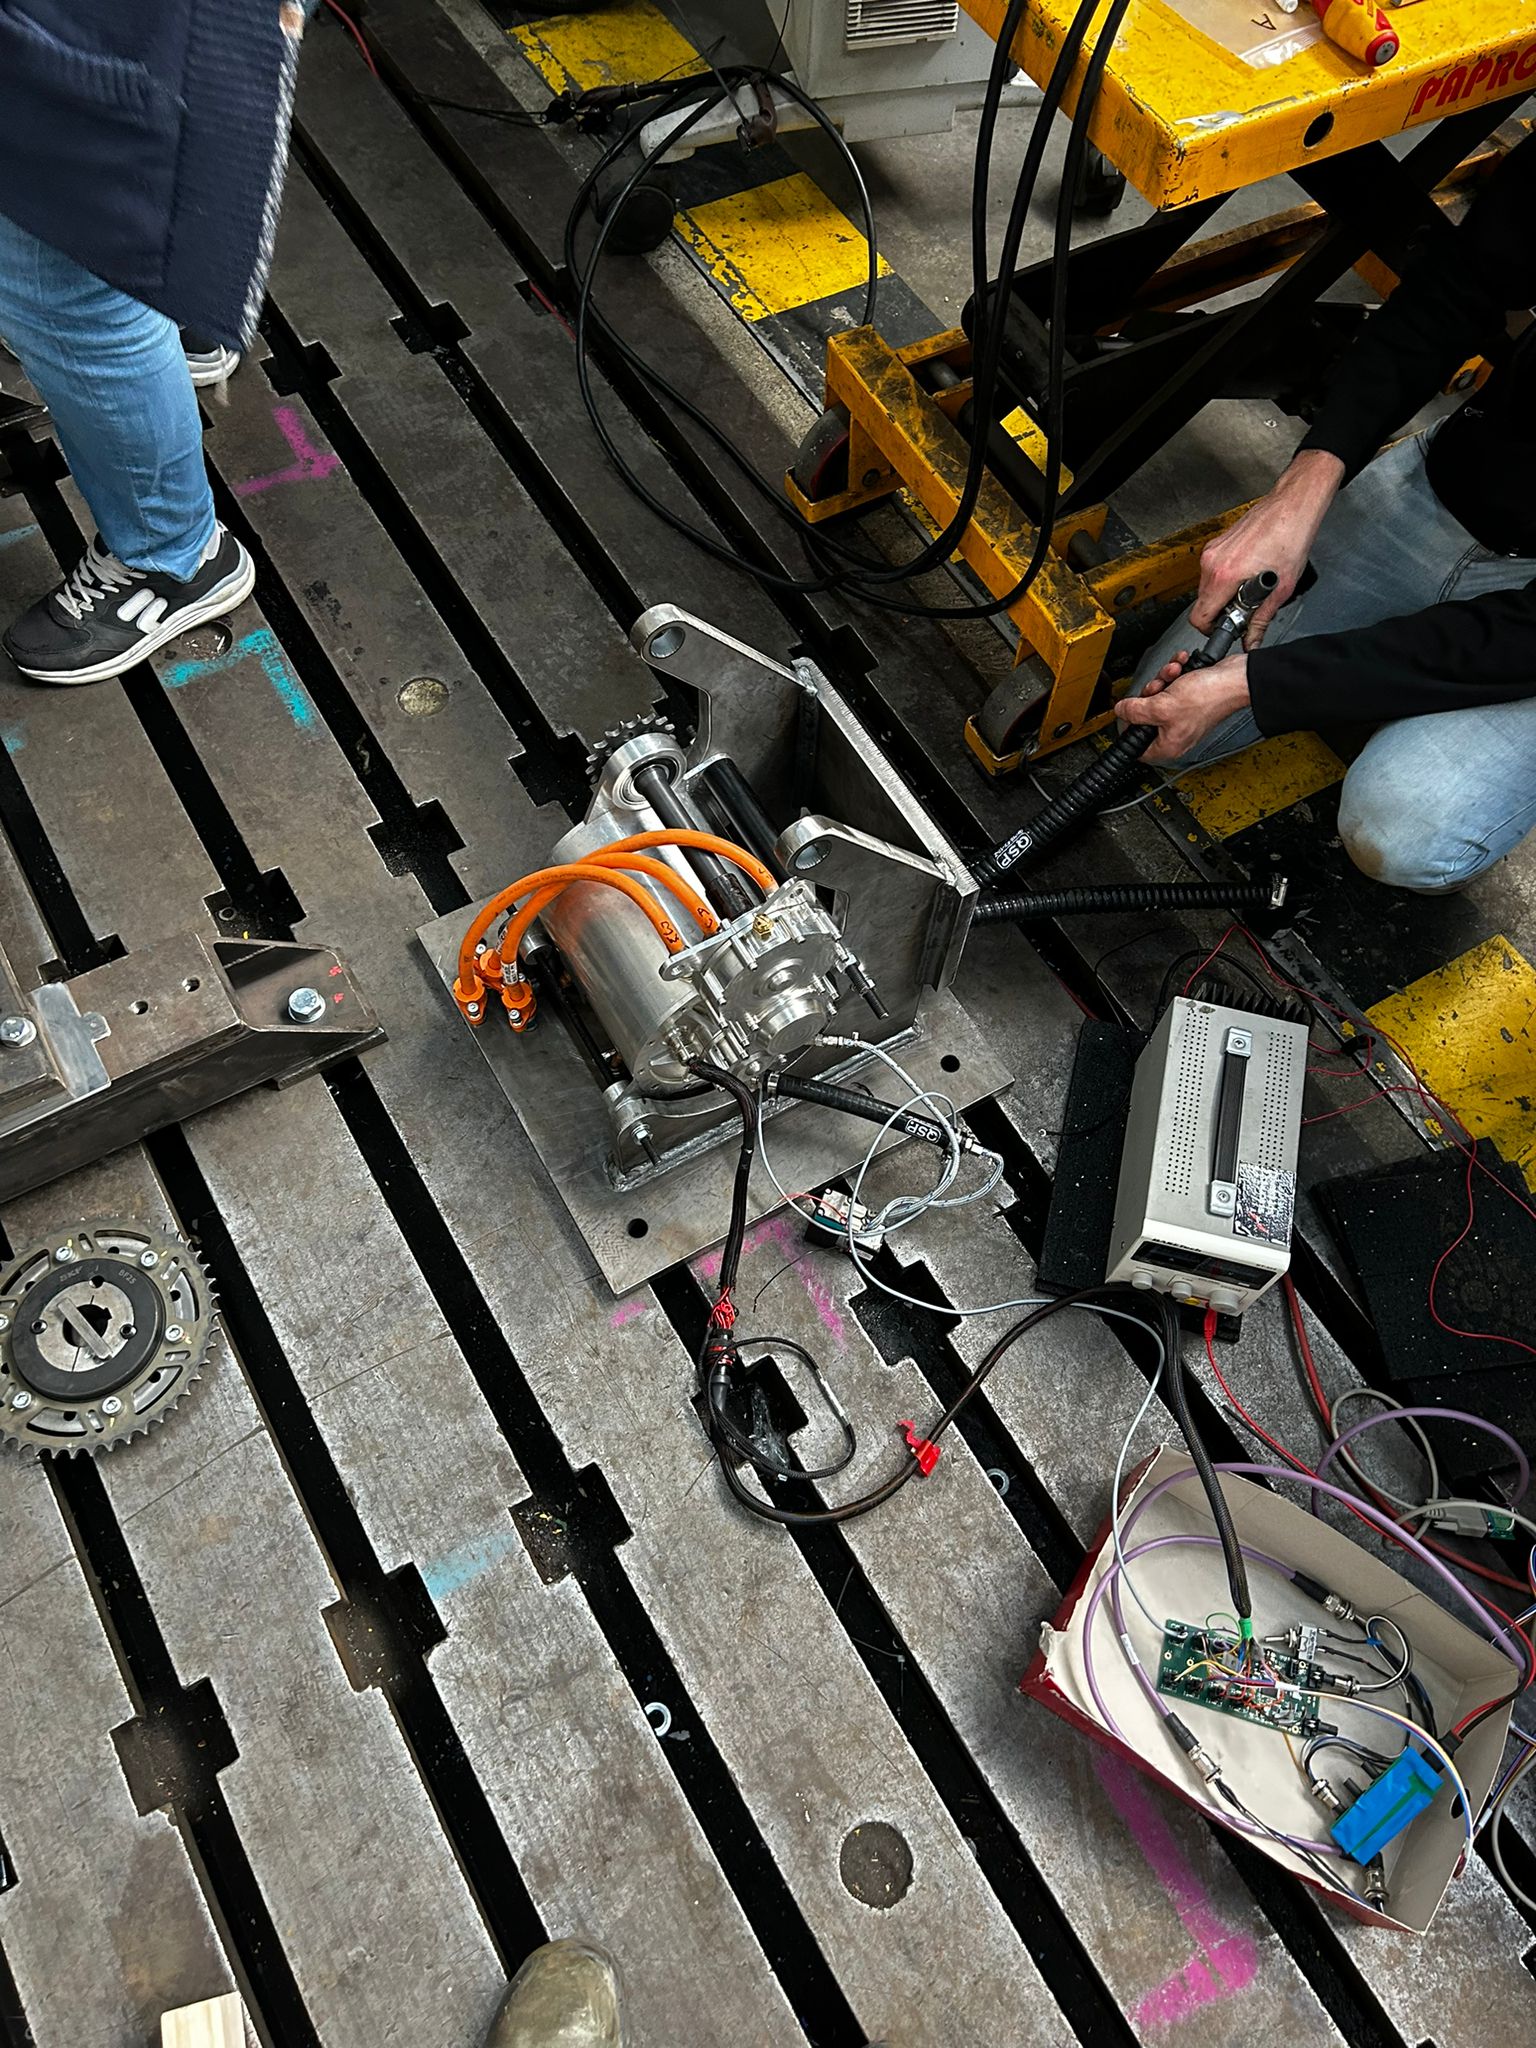
ELECTRIC SUPERBIKE TWENTE · POWERTRAIN

Electric powertrain test hardware

Hands-on powertrain work alongside numerical engineering: electric-motor hardware, shaft-and-bearing assemblies, and the instrumentation around a mechanical test setup.

  • Electric powertrain
  • Mechanical integration
  • Test hardware
Workshop test rig with a shaft assembly, bearing supports and instrumentation.
Mechanical test assemblyShafts, bearings and test hardware on the workshop bed.
Electric motor with orange power cables, instrument wiring and a metal mounting frame.
Motor & instrumentationElectric motor, mounting hardware and test connections.

Let’s talk engineering.

For research, technical exchange or a conversation about the work.